How to Compare the Environmental Benefits of Plant Proteins?

Time:2026-09-08 Author:Sophia
0%

How to Compare the Environmental Benefits of Plant Proteins?

When asking “what are the environmental benefits of vegetal proteins,” comparison must begin with evidence, not assumptions. Plant proteins often require less land and generate fewer greenhouse-gas emissions than many animal proteins. However, results vary between soybeans, peas, lentils, chickpeas, and wheat protein. Farming methods matter.

Joseph Poore, an environmental scientist at the University of Oxford, said, “A vegan diet is probably the single biggest way to reduce your impact on planet Earth.” His statement offers useful direction, but it should not end the analysis. A fair comparison measures impacts per 100 grams of protein, not merely per kilogram of product. This approach reveals how protein density changes the result.

Lifecycle assessments can examine climate emissions, freshwater use, land occupation, fertilizer demand, and biodiversity pressure. A soybean field in one region may perform differently from a pea farm elsewhere. Processing also changes the picture. Plant-based burgers may require energy, packaging, and transport. Still, these factors should be compared with the full footprint of animal-based alternatives, including feed production and livestock emissions.

No comparison is perfect. Data gaps remain.

I have found that simple claims can mislead readers. Local crops are not automatically better, and imported legumes are not always worse. The strongest evaluation combines transparent sources, consistent boundaries, and realistic serving sizes. It also asks what happens beyond the factory gate: soil health, farmer practices, water scarcity, and consumer waste. That broader lens makes environmental benefits clearer, while leaving room for honest uncertainty.
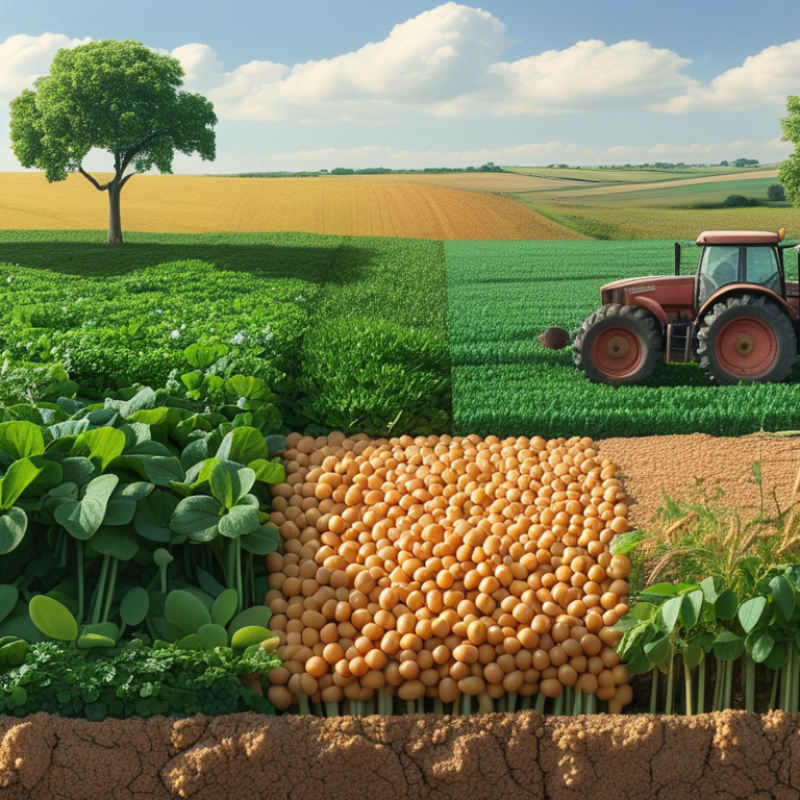
How to Compare the Environmental Benefits of Plant Proteins?

Define the Environmental Scope of Plant Protein Comparison

Environmental comparison begins with a boundary, not a headline number. Define whether the study measures farm production, processing, transport, retail, cooking, and waste. A narrow farm-gate scope may favor one ingredient while hiding energy used for drying or extrusion. A credible assessment should state its functional unit, such as one kilogram of protein, one serving, or one calorie. These units answer different questions.

Climate impact needs more than carbon dioxide. Include methane, nitrous oxide, land-use change, and carbon storage, reported as carbon dioxide equivalents. The Food and Agriculture Organization estimated livestock supply chains produced 7.1 gigatonnes of CO2e in 2010, or about 14.5% of human-caused emissions. However, plant proteins also require land, irrigation, fertilizer, and electricity. The IPCC Sixth Assessment Report links dietary shifts toward lower-emission foods with substantial mitigation potential, but outcomes depend on local production systems.

Water should reflect scarcity, not only volume. The Water Footprint Network’s assessments distinguish green, blue, and grey water, while ISO 14046 supports broader water-footprint accounting. Add eutrophication, acidification, biodiversity pressure, soil health, and packaging when relevant. Poore and Nemecek’s Science study found wide variation among foods, even within the same category. That finding deserves caution. Supply chains change, datasets use assumptions, and averages can conceal seasonal realities. A transparent comparison should publish its sources, allocation method, geography, and uncertainty range. No metric is perfect. The boundary must be visible.

How to Compare the Environmental Benefits of Plant Proteins? – Define the Environmental Scope of Plant Protein Comparison

Indicative environmental comparison of common plant-protein sources, normalized to 100 g of protein.

Plant Protein Source Typical Protein Concentration in Raw Crop Climate Impact
(kg CO₂e/100 g Protein)
Agricultural Land Use
(m²/100 g Protein)
Water Scarcity Use
(L/100 g Protein)
Freshwater Eutrophication
(g PO₄e/100 g Protein)
Nitrogen-Fixation Potential Key Environmental Considerations
Soybean 36–40% 0.8–2.0 0.7–1.3 50–180 0.4–1.2 High High protein yield per hectare and biological nitrogen fixation; impacts can increase where land-use change, irrigation, or long-distance processing is involved.
Pea 20–25% 0.7–1.5 0.6–1.2 35–150 0.3–1.0 High Usually associated with relatively low greenhouse-gas emissions and limited fertilizer requirements; outcomes depend on yield, drying, and protein-isolate processing.
Lentil 23–26% 0.6–1.4 0.5–1.1 30–140 0.3–1.0 High Efficient pulse crop with nitrogen fixation; lower yields in some regions can increase land use per unit of protein.
Chickpea 19–22% 1.0–2.0 0.8–1.6 40–220 0.4–1.3 High Can improve soil nitrogen balance through fixation; water impacts vary substantially by climate, irrigation, and regional yield.
Fava Bean 24–27% 0.7–1.6 0.6–1.3 35–170 0.3–1.1 High Strong nitrogen-fixing capacity and useful role in crop rotations; regional productivity and processing energy influence the final footprint.
Wheat Protein 10–14% 1.0–2.2 1.0–2.0 45–190 0.7–2.0 Low Generally efficient in temperate systems, but relies more heavily on synthetic nitrogen fertilizer than legume crops; gluten extraction adds processing requirements.
Rice Protein 7–9% 2.0–4.0 1.8–3.5 100–400 0.8–2.5 Low Rice cultivation can have higher climate impacts because flooded fields generate methane; irrigation, milling, and protein extraction can add further impacts.
How to interpret the comparison: Lower values generally indicate lower environmental pressure, but no single metric defines the best plant protein. Results are influenced by crop yield, soil conditions, irrigation, fertilizer application, land-use change, transport, processing energy, allocation method, and the selected functional unit.
Scope and data basis: Indicative global ranges synthesized from peer-reviewed life-cycle assessment literature and agricultural datasets, including Poore and Nemecek (2018, Science) and subsequent plant-protein LCAs. Values represent broad cradle-to-farm-gate or primary-processing ranges and are not brand- or company-specific. Water values refer to water-scarcity-weighted use rather than simple water withdrawal.

Identify Key Metrics for Measuring Environmental Performance

Comparing plant proteins requires more than counting carbon. Track greenhouse gas emissions in kilograms of CO2-equivalent per kilogram of edible protein. Poore and Nemecek’s Science study examined 38,700 farms and found that food production creates about 26% of global emissions. Its dataset also shows major differences between protein sources. Beef generally produces many times more emissions than pulses. However, averages can hide farming conditions.

Land use is another strong metric. Measure square meters occupied for one year per 100 grams of protein. This includes grazing land and feed crops. The same study found that livestock uses most agricultural land, despite supplying a smaller share of global protein and calories.

Water needs closer inspection. The Water Footprint Network reports that producing one kilogram of beef can require around 15,000 liters of water, while pulses usually require far less. Yet regional irrigation can change the result sharply.

A serious comparison should include eutrophication, acidification, fertilizer use, and biodiversity impacts. Report results per gram of protein, not only per kilogram of food. Otherwise, protein density can distort the comparison. Use life-cycle assessments with transparent farm boundaries and local data. Some figures remain uncertain. Soil carbon storage is difficult to measure, and supply-chain assumptions can shift rankings. That imperfection matters. A reliable assessment should show the range, method, and missing data beside every headline number.

Gather Comparable Life Cycle Data Across Protein Sources

Comparing the environmental benefits of plant proteins requires more than reading a single emissions figure. Gather comparable life cycle data across protein sources before drawing conclusions. A fair study should use the same functional unit, such as one kilogram of protein or one serving. These measures can produce very different results.

Keep boundaries aligned. Include farming, processing, packaging, transport, refrigeration, and waste treatment for every source. If one dataset stops at the farm and another reaches the supermarket, the comparison becomes misleading. Record land use, water consumption, energy demand, and greenhouse gas emissions separately. One combined score can hide important trade-offs.

Data quality matters. Prefer recent, region-specific measurements from farms and processing facilities. Secondary databases can help, but they may contain older yields or assumptions. Check whether fertilizer use, irrigation, and electricity sources match local conditions. Protein crops grown in dry regions may need more irrigation than similar crops elsewhere. Processing intensity also changes the result.

Allocation requires careful attention. When a crop creates oil, flour, or animal feed, divide impacts by mass, economic value, or nutritional value. Each method tells a different story. There is no universally perfect choice. Report all major assumptions and include uncertainty ranges. Small differences may disappear inside those ranges. Peer review improves credibility, yet published studies can still reflect limited data. A transparent spreadsheet, clear sources, and sensitivity testing let readers inspect the evidence rather than trust an attractive headline.

Adjust Results for Nutrition, Production Methods, and Serving Sizes

How to Compare the Environmental Benefits of Plant Proteins?

A fair comparison starts with nutrition, not weight alone. Compare foods by equal amounts of digestible protein, such as 25 grams. The FAO recommends digestibility-based measures, including DIAAS, because protein quality varies between foods. Some plant proteins also provide fiber, iron, or folate. Others may require careful nutrient planning. That difference matters.

Production methods can change the result sharply. Poore and Nemecek’s 2018 Science study found that beef protein typically creates far more greenhouse gas emissions than pulse-based protein. Their global dataset also shows that farm production usually dominates food emissions. Fertilizer use, irrigation, soil management, and land conversion deserve attention. A low-impact crop can perform poorly under intensive irrigation. The reverse can happen, too.

Serving size changes the environmental story. The Water Footprint Network estimates about 15,400 liters of water per kilogram of beef, compared with roughly 4,000 liters for pulses. Yet people rarely eat one kilogram at once. Compare a normal serving containing equal protein instead. A bowl of cooked lentils may weigh more than a small portion of concentrated protein food. That is not a flaw. It is a useful correction.

Regional data remains imperfect. Some studies combine farms with very different climates and practices. Packaging and processing can also alter results, although production often remains the largest factor. A transparent comparison should report the dataset, serving size, protein quality method, and production assumptions. Otherwise, impressive numbers may hide ordinary uncertainty.

Interpret Trade-Offs and Regional Differences in Environmental Benefits

Comparing plant proteins requires more than reading a single emissions figure. A credible assessment tracks farm inputs, processing energy, transport, water use, and land occupation. Life-cycle studies often report emissions per kilogram of protein, but that measure can mislead. Protein quality, edible yield, and serving size also affect the comparison. Look beyond the headline number. A dry crop may need little irrigation yet produce less protein per hectare. That difference changes its practical land benefit.

Regional context can reverse an apparent advantage. In a rain-fed temperate region, pulses may grow with limited irrigation. In an arid area, the same crop could depend on scarce groundwater. Conversely, a crop with higher farm emissions might use local rainfall and avoid long-distance transport. Electricity matters during milling, heating, and drying. Cleaner grids reduce processing impacts, while coal-heavy grids increase them. Soil conditions matter too. Poorly managed fields can lose carbon and nutrients, even when the protein is plant-based.

A careful comparison should name its assumptions and data year. I would check whether the study measures blue water, green water, or both. I would also ask who benefits from land-use changes and who bears the risks. Numbers are not neutral. Some studies use regional averages that hide a farmer’s actual conditions. Others count transport heavily but overlook refrigeration or household cooking. These gaps do not invalidate the evidence, but they demand modest claims. A field beside a shrinking reservoir tells a different story than one fed by winter rain.

FAQS

: What is the fairest way to compare plant proteins?

: Compare equal amounts of digestible protein, such as 25 grams. Weight alone can mislead.

Which environmental metrics matter most?

Track emissions, land use, water use, eutrophication, acidification, fertilizer use, and biodiversity impacts.

Why should results use protein measurements?

Reporting impacts per 100 grams of protein reflects nutritional value better than measuring food weight alone.

How much land can protein production require?

Measure square meters used for one year per 100 grams of protein. Include grazing areas and feed crops.

Does plant protein always use less water?

Usually, pulses require less water than beef. Regional irrigation can change the result sharply.

Can farming methods change environmental results?

Yes. Fertilizers, irrigation, soil management, and land conversion can greatly alter a crop’s impact.

Why do serving sizes matter?

Compare normal servings with equal protein amounts. A bowl of cooked lentils may weigh more, but that is not a problem.

How reliable are environmental comparisons?

They are useful, but imperfect. Soil carbon is difficult to measure, and missing data can change rankings.

What information should a transparent assessment include?

Show the dataset, farm boundaries, serving size, protein-quality method, local conditions, and uncertainty range. Some assumptions remain debatable.

Conclusion

Comparing the environmental benefits of plant proteins requires a clear scope that considers climate change, land use, water consumption, nutrient pollution, and biodiversity. The key question, “what are the environmental benefits of vegetal proteins,” cannot be answered through a single metric. A fair comparison should use consistent life cycle data covering farming, processing, transportation, storage, and preparation across different protein sources.

Results should also be adjusted for nutritional value, production methods, and serving sizes, since equal weight does not always provide equal protein or essential nutrients. For example, differences between rain-fed and irrigated systems, or between intensive and low-input agriculture, can significantly affect outcomes. Interpreting these trade-offs requires attention to regional conditions, including climate, soil quality, available water, energy systems, and farming practices. Overall, plant proteins often offer opportunities to reduce resource use and emissions, but their environmental performance depends on how and where they are produced.

Sophia

Sophia

Sophia is a dedicated marketing professional with an exceptional depth of knowledge about her company's products and services. With a keen understanding of market trends and customer needs, she crafts insightful blog posts that not only inform but also engage readers, enriching the company’s online......